
Accidents in the Workplace: Where Do The Risks Lie?
UPDATE: We’ve now revamped this post to include as much new data from the year 2013/14 as possible – read on for changes in incident rates and any trends. For full information, read the HSE’s annual accident report here.
We’re all well aware that nowhere is completely safe – but that doesn’t mean you should have to put up with an unnecessarily dangerous working environment. We’ve compiled figures from various sources, including the Health & Safety Executive (HSE), Office of National Statistics (ONS) and the industry publication The Law Society Gazette, to run through just what the risks are at workplaces across the UK.
Whether you work in construction or an office, these interactive graphs will give you an insight over how safe or unsafe your workplace might be. You can download the data from these graphs for your own reference or research, and visit the data sources for further information.
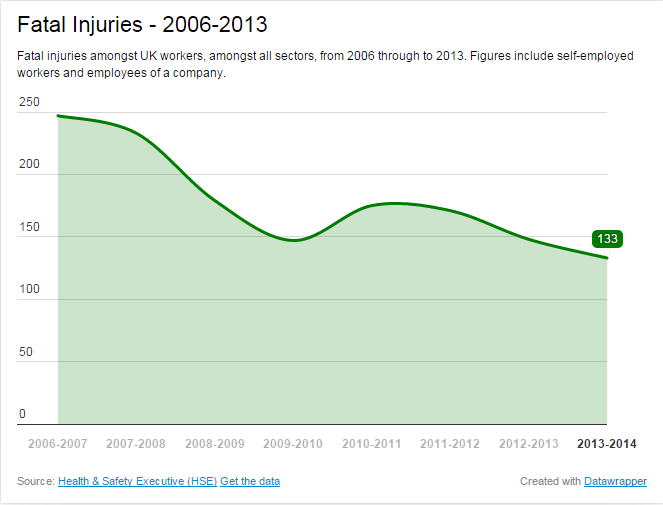
We’ll start with the serious; there are some very dangerous professions and industries, but even some of the less risky can (on rare occasions) contribute to national totals. Looking at the most recently updated statistics for 2013/14, we can see that there is actually beginning to be a downward trend – over the last year there were 133 fatal accidents at work, which is down from 148 for 2012/13 and even further down from 171 in 2011/12.
It’s the industrial sectors which are typically the most dangerous industries to work in; while the HSE are still yet to release their most up to date statistics (which were missing from our last update to this post), the most recent figures they released for 2011 still paint a clear picture of which industries are the most dangerous to work in.
Construction tops the list with 46 fatalities, and those working in extractive or utilities-based sectors being the safest.
Regions also impact the risk – working in agriculture in the South West is statistically riskier than London or the West Midlands.
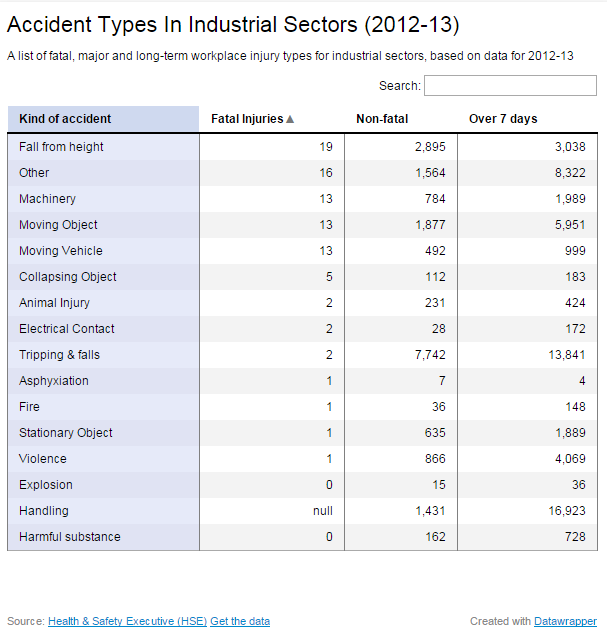
So what’s behind these figures? We’ve compiled a comprehensive list of the main injury types sustained in these more dangerous roles, looking at fatalities as well as serious injuries and those accidents which leave employees unable to work for more than seven days.
Having updating our data from last year, we can see that falling from a height is still the most common fatal injury, tripping or falling is the most common serious injury, and injuries sustained while carrying or handling loads is the type of incident most likely to leave you off work for more than a week. While we have seen relatively universal reductions across the board for all types of injury since 2013, the overall trends and risks remain the same.
Incidents like being subjected to explosions or types asphyxiation (such as drowning) are perhaps the least common of all serious incidents, and those that do happen are statistically unlikely to prove fatal or majorly serious.
With any type of accident, the employer needs to take responsibility and examine what has happened – and if they are at fault, appropriate action does need to be taken. However, government figures obtained by the Law Society Gazette show that of the 610,000 workplace accidents in 2012/13, just 90,000 claims were made.
Unfortunately, the publication hasn’t released any statistics for the last 12 months so we’re unable to see if there are any trends – however, it’s still clear that more people need to claim.
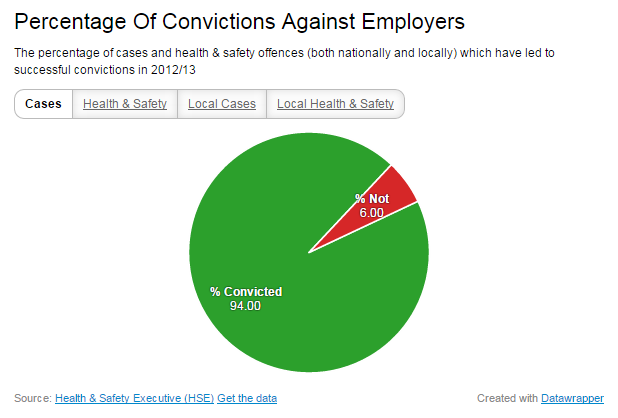
What is positive is that the number of convictions of cases brought forward is still high – despite a 1% reduction in convictions compared with 2013’s data, 94% of all cases resulted in a successful conviction.
This means that there are employees out there who can be making valid claims; there is a suggestion that many who don’t make a claim feel intimidated by large companies and the stigma of a perceived ‘have-a-go’ compensation culture.
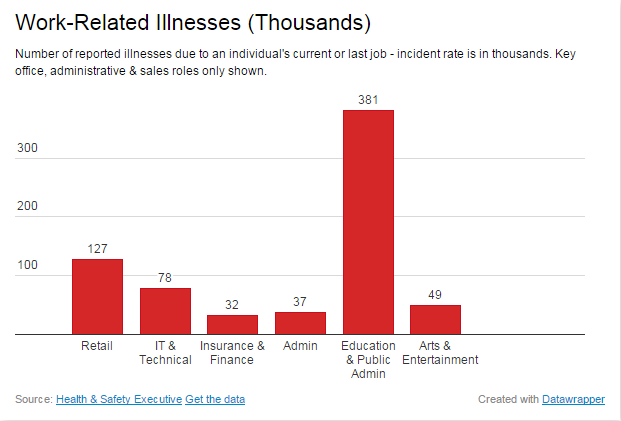
It’s not always about physical injuries due to accidents, either – there are plenty of situations whereby you could develop an illness as a result of your job, as well as instances where your employer could be at fault. For example, not providing the adequate safety measures in place for office workers could result in repetitive strain injuries, damage to eyesight and back-related issues.
Our new data for 2014 has shown the trends compared with the previous year still continue – Education & Public Admin is still the industry with the highest rates of work-related illnesses, whereas Insurance & Finance are the lowest. What we have seen change is the volume – this is generally higher across the board, with the exception of Insurance & Finance and Retail which both saw noticeable reductions.
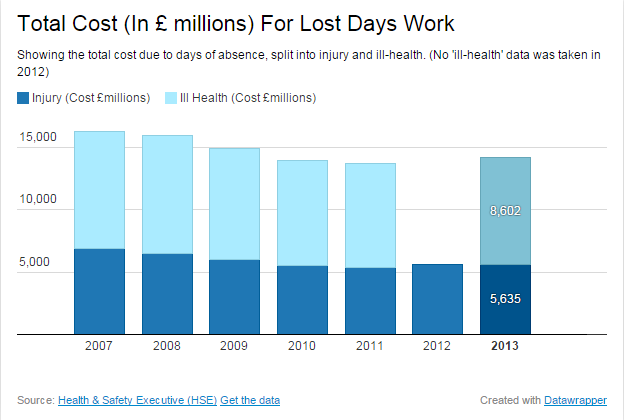
The end result of all the above is a cost to UK businesses and, as such, the economy as a whole. While you can see from the data that costs due to missed days at work is down to £14.2bn in 2014 from £16.3bn in 2007, this seems to be in line with a general decreasing trend of accidents at work (see the first graph).
However, what we are starting to see off the back of this year’s information is a gradual increase in the cost to the economy in terms of ill-health – up to £8.6bn in 2013/14 from £8.3bn in 2011, which is a £300 million increase.
Don’t let yourself become another statistic – if you’ve suffered any kind of injury in the workplace, whether it’s a major incapacitating accident or a simple fall, then get in touch with our expert personal injury solicitors here at Tranter Cleere. We work across the UK and can help you get the help and compensation you deserve – call us today on 0800 6 12 11 13.